
Data is the backbone of decision-making in modern businesses. But raw data—like endless spreadsheets of transactions—can be overwhelming. The Star Schema is one of the simplest, most effective, and scalable ways to structure data for analysis.
Think of it as turning messy raw numbers into a neatly organized story.
🌟 What is a Star Schema?
A Star Schema is a type of data model used in data warehouses and BI systems.
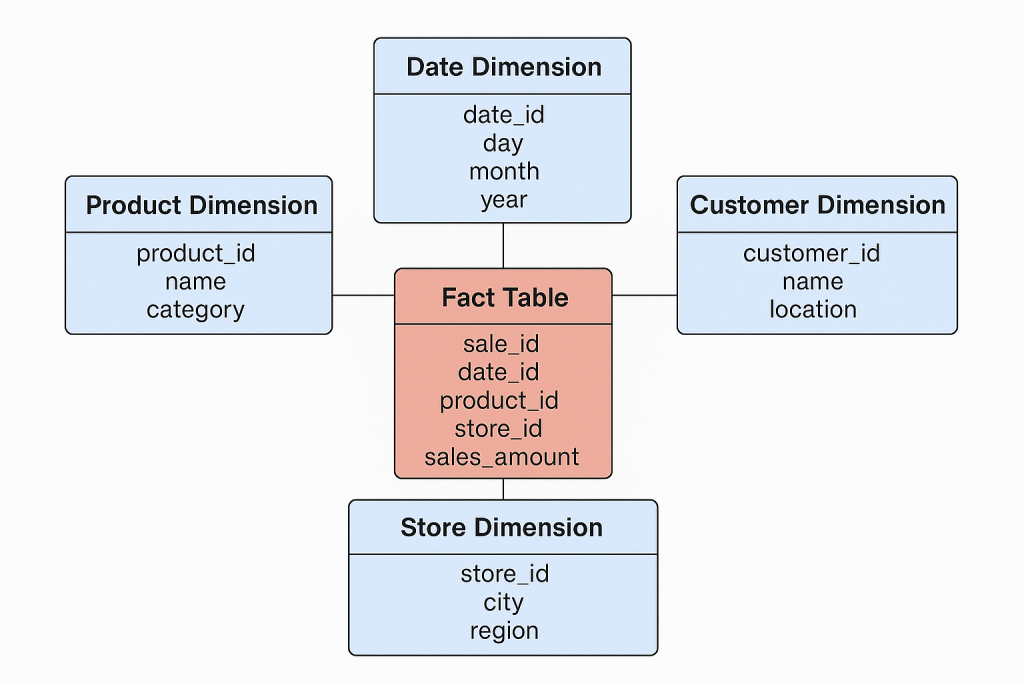
- At the center is a Fact Table (the numbers you measure, like sales or revenue).
- Around it are Dimension Tables (the details that give those numbers meaning, like products, customers, or dates).
Visually, it looks like a star, with the fact table at the center and dimensions as the points.
🧩 Key Components
1. Fact Table (The Core)
- Stores quantitative data—measurable facts.
- Usually the largest table (millions to billions of rows).
- Example:
fact_sales- Columns:
sale_id,date_id,product_id,customer_id,store_id,sales_amount,quantity.
- Columns:
2. Dimension Tables (The Details)
- Provide context for the facts.
- Smaller and descriptive.
- Examples:
- dim_product →
product_id,name,category,brand. - dim_customer →
customer_id,name,location,age_group. - dim_date →
date_id,day,month,year,quarter. - dim_store →
store_id,city,region,manager.
- dim_product →
🚀 Why Use a Star Schema?
- Simplicity → Easy to explain and query.
- Performance → Optimized for aggregations and joins.
- Scalability → Handles billions of rows with modern data warehouses.
- Flexibility → Works with any BI tool (Power BI, Tableau, Looker, dbt).
🔍 Real-World Use Cases
1. Retail Sales Analytics
A supermarket chain wants to know:
- Which products are top-sellers by region?
- Who are the most loyal customers?
- What’s the monthly revenue trend?
👉 With a Star Schema:
- Fact Table → sales transactions.
- Dimensions → products, customers, stores, dates.
Running queries like “total sales by product category in Q3” becomes straightforward and fast.
2. Healthcare Analytics
A hospital tracks patient visits and treatments:
- Fact Table → treatments (cost, duration, outcome).
- Dimensions → patients, doctors, departments, dates.
They can easily answer:
- What’s the average treatment cost per department?
- Which doctors handle the most cases in cardiology?
3. E-commerce Platform
An online marketplace wants to monitor performance:
- Fact Table → orders (order_value, discount, shipping_cost).
- Dimensions → customers, sellers, products, dates, locations.
They can analyze:
- Which sellers drive the most revenue?
- How do promotions affect customer buying behavior?
🛠️ Example Query
👉 Question: What were the total sales by product category in July 2025?
SELECT d.category, SUM(f.sales_amount) AS total_sales
FROM fact_sales f
JOIN dim_product d ON f.product_id = d.product_id
JOIN dim_date dt ON f.date_id = dt.date_id
WHERE dt.month = 'July' AND dt.year = 2025
GROUP BY d.category;
This query runs quickly because the schema is designed for it.
⚡ Best Practices
- Keep Fact Tables lean: only keys + metrics.
- Use surrogate keys: avoid natural IDs (e.g., emails).
- Pre-build a Date Dimension: saves tons of time in time-based analysis.
- Document Dimensions clearly: business users should know what each column means.
- Start simple (Star) before complex (Snowflake): complexity only if necessary.
🆚 Star Schema vs Snowflake Schema
- Star Schema → Simple, fast, business-friendly.
- Snowflake Schema → Dimensions are normalized (split into smaller tables). Saves storage but adds query complexity.
👉 For beginners and most analytics, Star Schema wins for speed and simplicity.
🧠 Key Takeaways
- A Star Schema organizes data into Facts (numbers) and Dimensions (context).
- It’s simple, scalable, efficient, and business-friendly.
- Perfect for retail, healthcare, finance, e-commerce, or any analytics-heavy domain.
- Think of it as turning raw data into an optimized storybook for analysis.