
Introduction
Reporting of the data is very important part of every project as management wants to see the progress and benefit of the project. Every Project future depends on its benefits to the end user and it can measure and monitor using various type of report and Tabular Report is one of them. It is very easy to represent data in the form of the table so anyone in the project can understand the progress of the project and measure the quality of services.
For example, management wants to see the total number of benefits provided every day so they can release the fund based on that number. There are multiple ways to get the data but develop a report and share the link with management so they can monitor it by them self and release the fund based on that report and it will be live without any human intervention.
Tabular Birt Report Development
This section of the tutorial will help the developer to develop sample Tabular Birt Report.
Please follow step by step instruction to develop the Birt Report in below section.
IBM Cúram Birt Project already configured and working. There would not be any issue.

Change the Project Perspective to Report Design.

Explore to Curam BI Content Project to create a New Report, Developer has to make sure that perspective in eclipse is Report Design otherwise they would not be able to see some options.
Right Click on birt folder -> New – > Report to create a new report.

Once clicked on Report option from the previous steps then New Report Creation model window display. Enter the Report Name and click on Next button.

Once clicked on Next button from the previous screen then it navigate the next screen where developer can select the report templates. The eclipse Birt has many pre-defined template which can be used so it will reduce total development time. We are using Blank Report Template to learn few more option to develop reports.

Example: click on My First Report

By clicking on Finish button then blank report will be created and other options like Data Source, Data Set, Data Cubes, Report Parameters will be available to set. Developer has to set at least Data Source & Data Sets to develop Report.

Data Source Configuration
Data Source configuration is very important as the developer has to configure database connection related information like Driver Class, Database URL, Host Name, Port Number, User Name, Password & JNDI URL.
The developer can set Data Source by Right click on Data Source folder in the left-hand side window.

By Clicking on New Data Source option then it navigates to New Data Source Creation screen. Select below option and click on Next button.
- Select Radio button – “Create from a data source type in the following list”.
- JDBC Data Source

Once clicked on Next button then it navigates to Database configuration window. The developer has to provide reporting database configuration. Please find the screenshot for more information about configuration. The developer can test the database connection using the Test Connection… button and complete the configuration by clicking on Finish button.

Test the database configuration, click on Test Connection… button.

Once developer clicked on Finish button then model window will disappear and database configuration will be completed.

Data Sets Configuration
Data Sets is another important configuration while developing birt report using eclipse and we can go further without this. The developer has to set SQL Query which helps to pull the records from the database which we configured in the previous step.
This sample report has very simple SQL Query but in the real project, the developer used to develop and configure SQL Query with 1000+ line or more which is not easy to run and manage by a Non-Technical Person like management.
Right Click on Data Sets option from the left-hand side of the report and Click on New Data Sets option.
Please follow steps to configure SQL Query in Data Sets window.

Once the developer clicked on New Data Sets option from the previous screen then it navigates to the new Data Sets Creation model window. Enter the Data Sets Name which will be used in the report and select appropriate option as per screenshot and Click on Next button.

By clicking on Next button then it navigates to window where the developer can see the Data Source and enter the SQL Query which they want to configure to pull the data. Click on Finish button to complete the configuration.

Once Clicked on the Finish button then it completes the Data Sets configuration and navigates to the Report page.

OUTCOME OF THE SQL QUERY (COLUMN):
APPLICATION_SOURCE
APPLICATION_TOTAL
TOTAL_APPLICATION
The Report Design
As we selected Blank Report Template while creating Report that’s why we are unable to see any contents of the Report but don’t worry, we are going to develop the report using Palette option from the left-hand side window.
We have a lot of options which developer can drag and drop into the reporting main area. Please find some important options given below –
Label: To add the Label in the Report.
Text: Add Text to the Report
Dynamic Text: The developer can set dynamic Text which will vary.
Data: The developer can configure Data derived from the Database.
Image: To Add image
There are many other option which we will cover in other tutorial.

Added Label and Drag and Drop the Data Sets which we created in our Previous steps and select all required column which developer wants to display on the Report. Please find the screenshot below –

By clicking on OK button then it add the Data Sets to Report.

The developer can run the report to verify the data through eclipse.
Click on Run -> View Report ->In Web Viewer

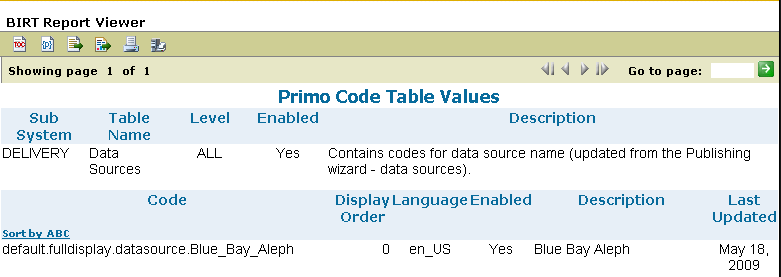
Sample Report Output


Hope, Reader understand all the steps mentioned in this tutorial to develop Tabular Birt Report. Please provide your feedback to improve the tutorial.