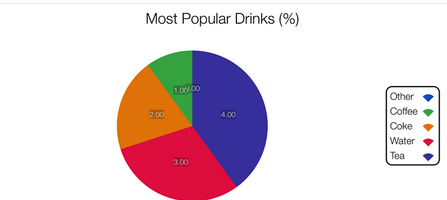
Introduction A Pie Chart is a type of graph that displays data in a circular graph. The pieces of the graph are proportional to the fraction of the whole in each category. In other words, each slice of the pie Read More …

A candle loses nothing by lighting another candle.
Introduction A Pie Chart is a type of graph that displays data in a circular graph. The pieces of the graph are proportional to the fraction of the whole in each category. In other words, each slice of the pie Read More …